

Key Takeaways
- Higher mortgage rates reduce what buyers can afford, but home prices do not always fall in response.
- Supply constraints can keep prices elevated even when rates rise and demand softens.
- The rate-price relationship plays out differently depending on the local market and overall economy.
- Affordability - not just price - is the more useful measure for buyers evaluating the market.
- Rate locks and timing strategies affect individual outcomes, but no one can reliably predict rate movements.
Mortgage Rate-Home Price Relationship
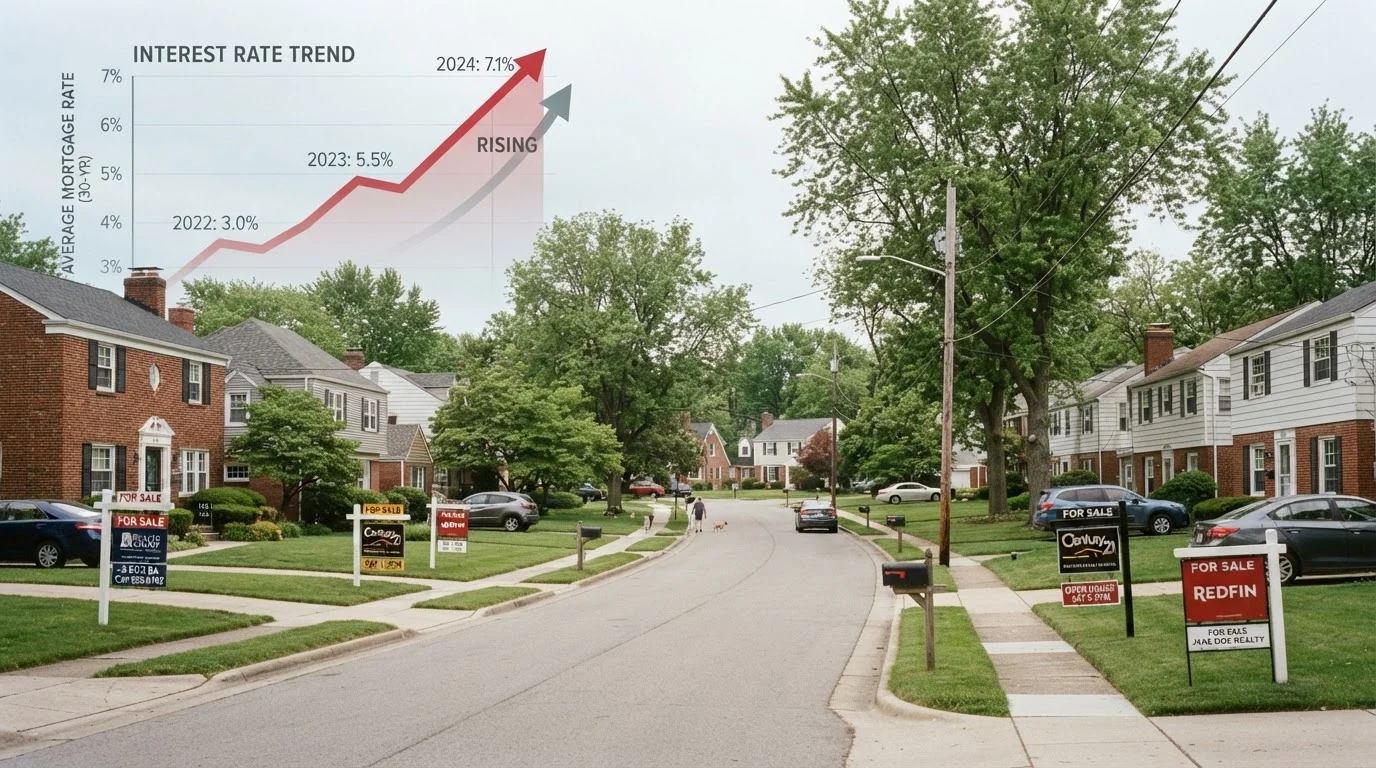
The connection between mortgage interest rates and home prices describes how changes in borrowing costs affect what buyers can afford, how many compete for homes, and ultimately what sellers can charge. When rates rise, monthly payments increase on the same loan amount, which tends to reduce buyer purchasing power. When rates fall, buyers can borrow more for the same monthly cost, which often pushes prices upward.
The relationship is not a fixed ratio - it is mediated by housing supply, local economic conditions, and the pace of rate change, which means price responses can lag rate moves by months or vary sharply by market.
The Mechanism: How Rates Shape Purchasing Power
Mortgage rates directly determine how much house a given income can support. When a lender evaluates a buyer's application, the rate - combined with the loan amount - sets the monthly payment. That payment must fit within a borrower's debt-to-income ratio, which is the share of gross monthly income a lender will allow to go toward debt obligations.
Consider a concrete illustration: at a 4% interest rate on a 30-year fixed mortgage, a $400,000 loan carries a principal-and-interest payment of roughly $1,910 per month. At 7%, that same loan costs about $2,660 per month - a difference of $750. To keep the monthly payment at $1,910 with a 7% rate, a buyer would need to borrow only around $287,000. In practical terms, a 3-percentage-point rate increase reduced this hypothetical buyer's purchasing power by more than $100,000.
This is why rate changes matter so much to affordability, even when listed home prices appear unchanged. For a deeper look at how affordability is formally measured, see Housing Affordability in America.
~$750/mo
Payment increase on $400K loan from 4% to 7% rate
Calculated using standard 30-year fixed amortization; illustrates how rate changes translate directly into monthly housing costs.
$100K+
Purchasing power lost per 3-point rate increase
Based on a buyer maintaining the same monthly payment target; the equivalent borrowing capacity drops by more than $100,000 when rates rise 3 percentage points.
~30%
Share of income typical lenders cap for housing costs
Most conventional mortgage guidelines use a debt-to-income threshold around 28-36%, meaning rate increases can disqualify borrowers at existing price points.
Why Prices Don't Simply Follow Rates Downward
A common assumption is that rising rates automatically push prices lower. The logic is straightforward: fewer buyers can qualify, demand drops, and sellers must cut prices to find a buyer. In a market with balanced supply, this can happen. But housing markets frequently deviate from that clean model.
The most significant counterweight is supply. When the number of homes available for sale is low, even reduced demand can outpace inventory, keeping prices stable or rising. This dynamic has played out visibly in many U.S. markets, where a chronic shortage of new construction and a reluctance among existing homeowners to list their properties created persistent upward price pressure despite rising borrowing costs.
The so-called lock-in effect compounds this problem. Homeowners who secured mortgages at historically low rates - say, 2.5% to 3.5% - have little financial incentive to sell and finance a new home at a significantly higher rate. The result is reduced inventory at exactly the moment rate-sensitive buyers are pulling back, which can neutralize the price correction many expect. To understand how supply and demand dynamics interact in the housing market more broadly, see How Housing Supply and Demand Actually Work.
What Rate Changes Mean for Buyers and Sellers
For buyers, rising rates compress affordability in two ways simultaneously: monthly payments rise, and qualifying loan amounts fall. This can force buyers into lower price tiers or out of the market entirely. However, if rate increases also reduce competition - fewer bidding wars, fewer waived contingencies - buyers who remain may find better negotiating positions than they had during a low-rate frenzy.
For sellers, the calculus depends on local conditions. A seller in an undersupplied market may see little price concession pressure even as rates climb, while a seller in a market with more inventory may need to adjust expectations. Sellers who are also buyers face the lock-in effect directly: selling a home to buy another may mean swapping a low fixed rate for a substantially higher one.
“The housing market is not a single market - it is thousands of local markets, each with its own supply constraints, demand drivers, and sensitivity to interest rate changes.”
— Lawrence Yun, Chief Economist, National Association of Realtors
Understanding which type of mortgage structure fits a given rate environment is also important. Fixed-Rate vs. Adjustable-Rate Mortgages outlines how the two structures compare and when each may make sense for different borrowers.
Reading the Relationship Accurately
Mortgage rates are one variable in a more complex system. Wage growth, employment levels, regional migration patterns, and local zoning and construction policies all influence whether rate changes translate into meaningful price shifts. In fast-growing job markets, demand can remain strong enough to absorb rate increases without significant price correction. In markets facing population decline or economic contraction, the same rate increase might trigger sharper price drops.
The practical takeaway for buyers and sellers is to treat mortgage rates as a key input into affordability analysis, not a sole predictor of price movement. Tracking local inventory levels, days on market, and the ratio of list price to sale price gives a more complete picture than rates alone. The broader economic forces shaping prices are explored in The Economic Forces Behind Rising Home Prices.
Making sense of those market signals becomes easier once you know how to interpret the data. Reading a Housing Market Report Without Getting Lost breaks down the key metrics in plain terms.
This article is for general informational and educational purposes only and does not constitute financial, investment, or legal advice. Consult a licensed financial adviser or mortgage professional for guidance specific to your situation.